

Markets have been on a roller coaster ride since Trump came into power, It’s obvious because Trump is a part-time president and a full-time trader. He played the tariff game in last year march & created flash crash in all the equity markets. All precious metals rallied like no tomorrow because of uncertainty he created & dumped hard in few days & stabilizing again. We are witnessing crazy spikes in crude oil from the past few days.
In the era of trump, there is breaking news for every 24 hours.
Let’s try to decode the chaos in the financial markets & understand probabilities of upcoming movement of price.
Nifty 50 :
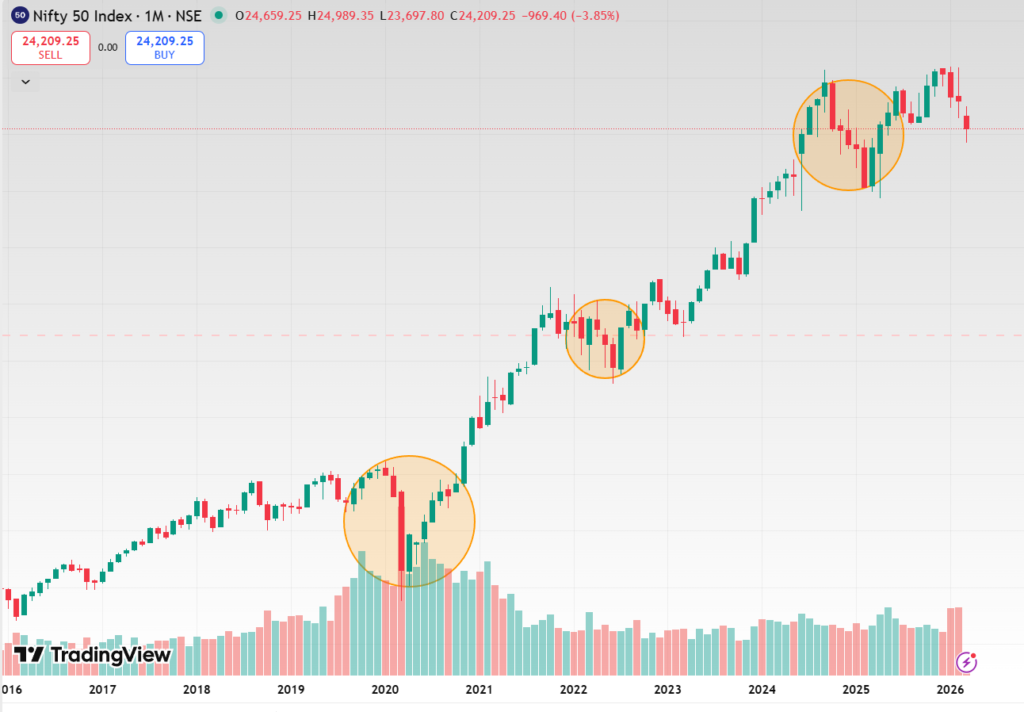
If you closely observe the monthly charts of our index, it is continuously making red candles from the past 3 months. It has happened several times before in the history.
In 2020 crash, after making 3 continuous red candles, once price got stabilized & breached the all time, we have seen the next leg of rally. Same is the case in 2022. In 2025, after continuous red candles formation index tried to breach all time high but buyers do not have strength to breach that all time high, so sellers took control of the price and it has been falling again.
If you are an SIP investor, please continue your SIP, don’t sell your investments.
If your risk appetite is high if you have plenty of cash to deploy, invest at supports or for each 3-5% fall of Nifty 50 in tranches. (For example, if you are planning to invest 1 lakh in the market, invest 20k when index reaches 23000, invest next 20k when it falls to 21500.)
When the index breach all time high, we will see next leg of rally, if you are swing trader, play with theme based stocks, defense stocks are rallying, we have seen sugar stocks rally in the last week. Understand the institutional footprints & operator’s play if you wanna make money even in these kind of markets.
Reasons for fall :
- IT Stocks got hammered badly which dragged the Nifty down
- Valuations are also not good when compared to the results
- Crude oil surge
- Trade deal uncertainity
- Constant FII selling on daily basis
Next Support Levels for Nifty 50 :
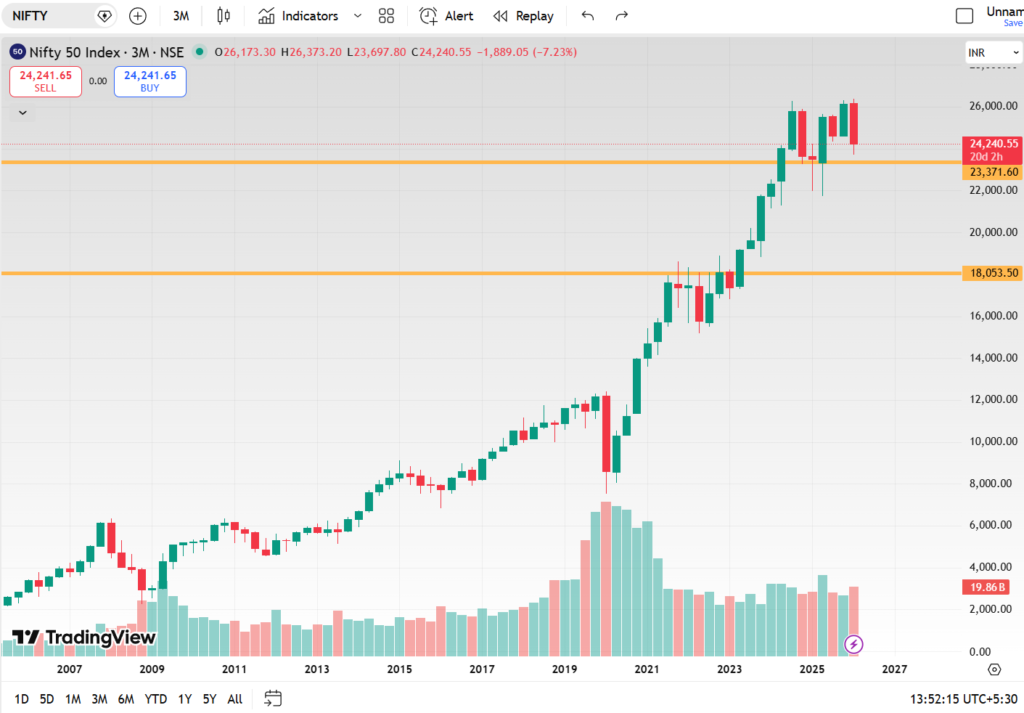
Below is the 3 Month chart of Nifty, currently it is trying to hold the support of 23371, if it breaks decisively due to any reason of panic, we might create a long wick by sweeping the liquidity of previous buyers who entered in last tarrif war panic and move higher quickly. If we continue to sustain below 23371 & fall is aggressive, we are heading slowly towards the next support which is around 18-19k.
Gold & Silver:
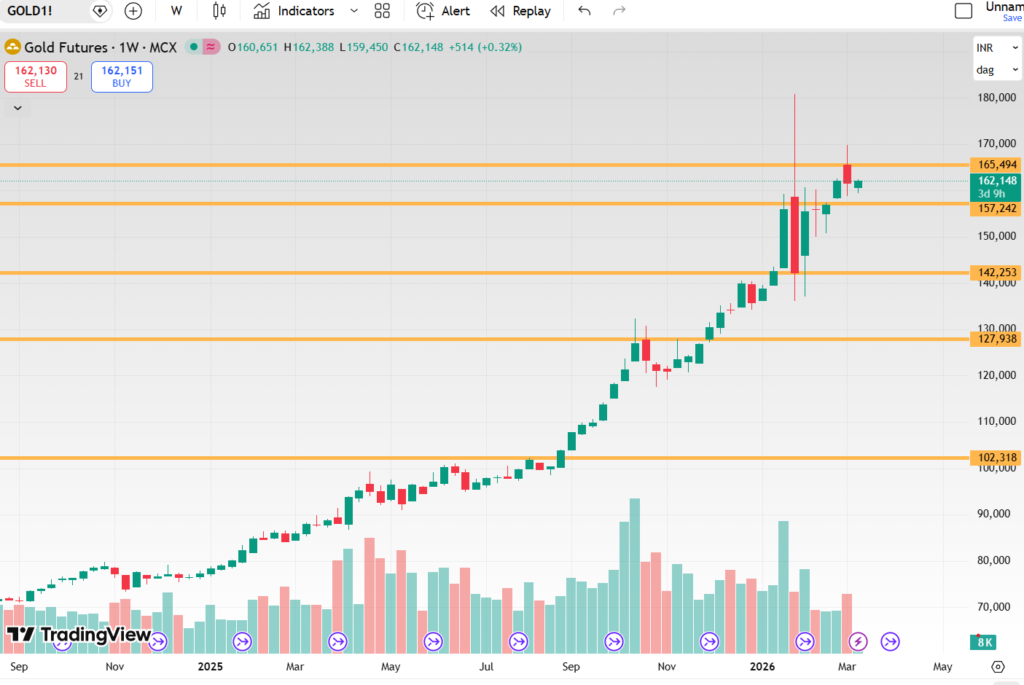
Gold price fluctuations depends in lot of geopolitical factors but in short term if prices break 157k decisively, we gonna see 142k soon. If prices sustain above 165k / 170k on weekly basis, we will see new all time high again.
- Is it safe to enter Gold at these prices ? No, Downside risk is more
- Diversify your portfolio with Gold, equities & bonds according to your risk appetite.
- There is no proper retracement in Gold prices after prices gave breakout above 1 lakh, let’s see how long prices sustain.
There are some interesting developments happening in the world, we are in the era of De-dollarisation & after trump came into power, world has lost trust on US, all the central banks around the world are dumping US yields & buying Gold. On the other hand, if any central bank has yields on their balance sheet, it will generate interest but Gold will have only price appreciation, so at some point central banks will also rethink of the short term downside risk of Gold, safe haven is no longer safe at these prices.
China stopped exporting precious metals, all the countries in the world are increasing Gold reserves, this is rhyming with De-dollarisation theme. Since china stopped exporting precious metals, Gold & Silver prices in china are slightly deviating from the international market prices. If our rupee value appreciates & if we take any step towards localization of prices by removing the international pegging, we can also see the Gold price deviation in coming years (Either by removing the direct pegging or by appreciation of depreciation of the currency)
For example, If you remember in the previous budget 2024/2025, when Govt changed import duty rules on Gold, suddenly prices fell 5-10% in Indian market but Gold prices in International market did’nt fall since it only effects the Indian prices, traders dumped Gold in the Indian market.
Silver:
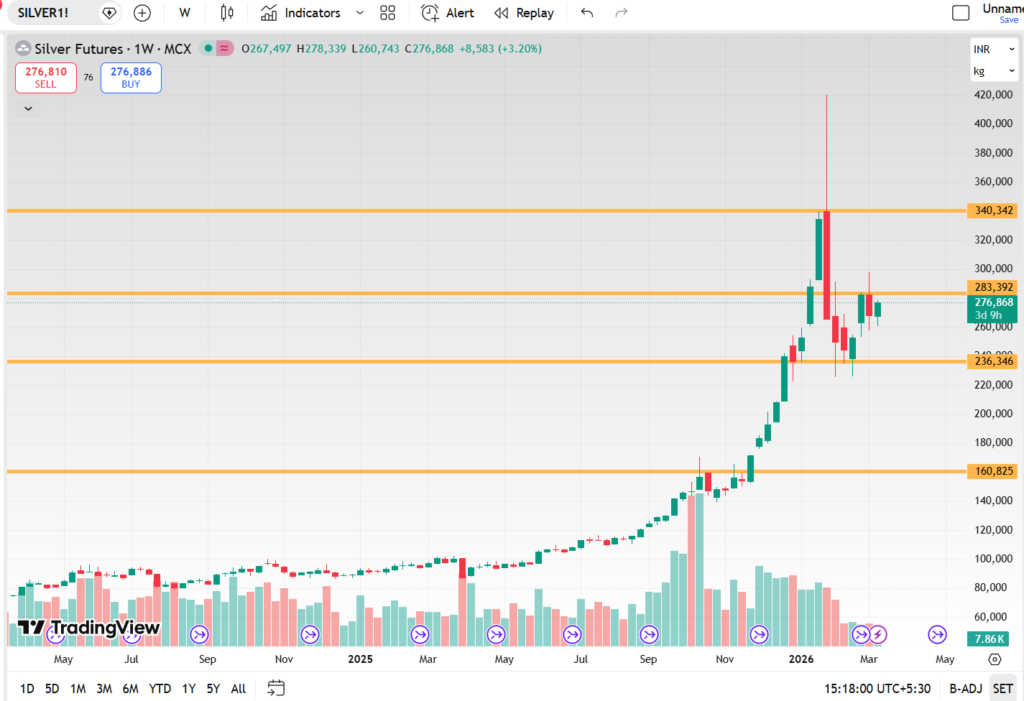
Silver chart looks exactly same like Gold. In short term, if price closes below 236k, it will head towards 160k or it will sweep the liquidity below 2 lakh & again move up by creating a wick. If prices break above 283k, it will inch towards 340k.
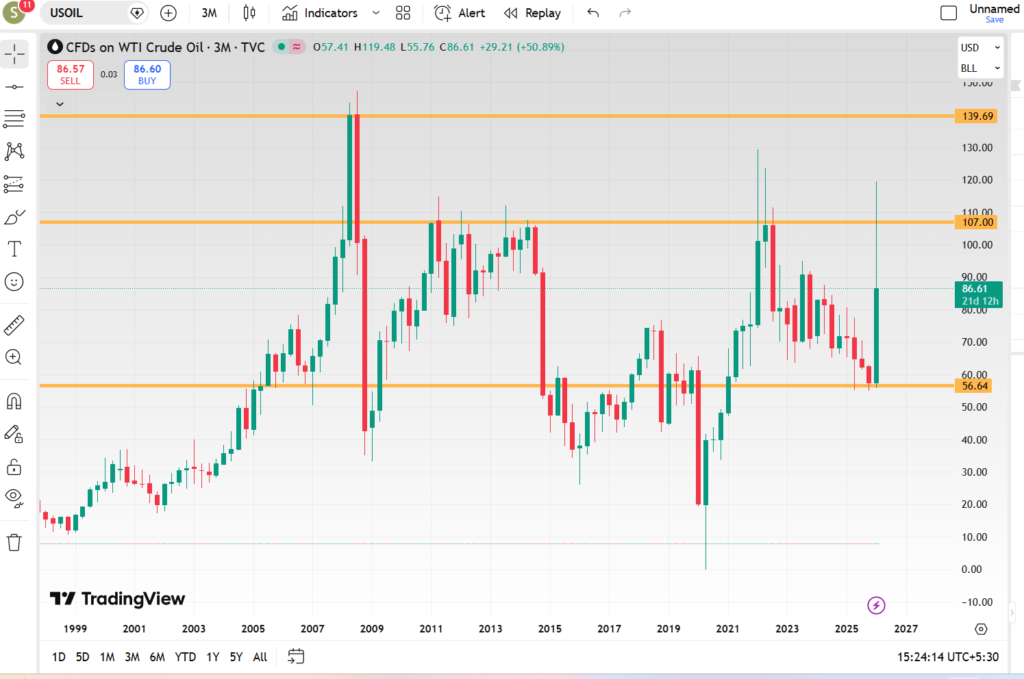
Crude Oil:
In the recent days, it is moving more volatile than bitcoin. 10-20% upswings are coming in intraday itself due to war tensions around the Globe. If crude keeps rising like no tomorrow, we gonna see massive crack in Indian markets, inflation will also increase. Crude will be the new hedge.
Below is the 3 month chart of Gold, it has increased from 56 to 120 & fallen back to 86. Previously as well, it has created long wicks around 120 levels, if prices sustain above 120, we will see 140 & all time as well. If war deescalates, crude oil will fall & stabilize at some point.
Disclaimer: I am not SEBI registered analyst, all the views mentioned here are just for educational purpose, there is no buy or sell recommendation. Consult your financial advisor before taking any investment decisions.